Do you want to understand your content marketing ROI and find ways to improve it?
Content marketing has become an effective way to attract, engage, and convert audiences. But it’s also a hard channel to measure. Paid ads show you exactly where every dollar goes. Content works quietly in the background, building trust and authority over time. That makes calculating its true return both tricky and necessary.
In this guide, you’ll learn what content marketing ROI means, why it matters, and the 15 metrics you can use to measure it. We’ll also cover practical ways to improve your ROI, how MailOptin can help you turn visitors into leads, and answers to common questions about measuring content performance.
Let’s get into it.
What Is Content Marketing ROI?
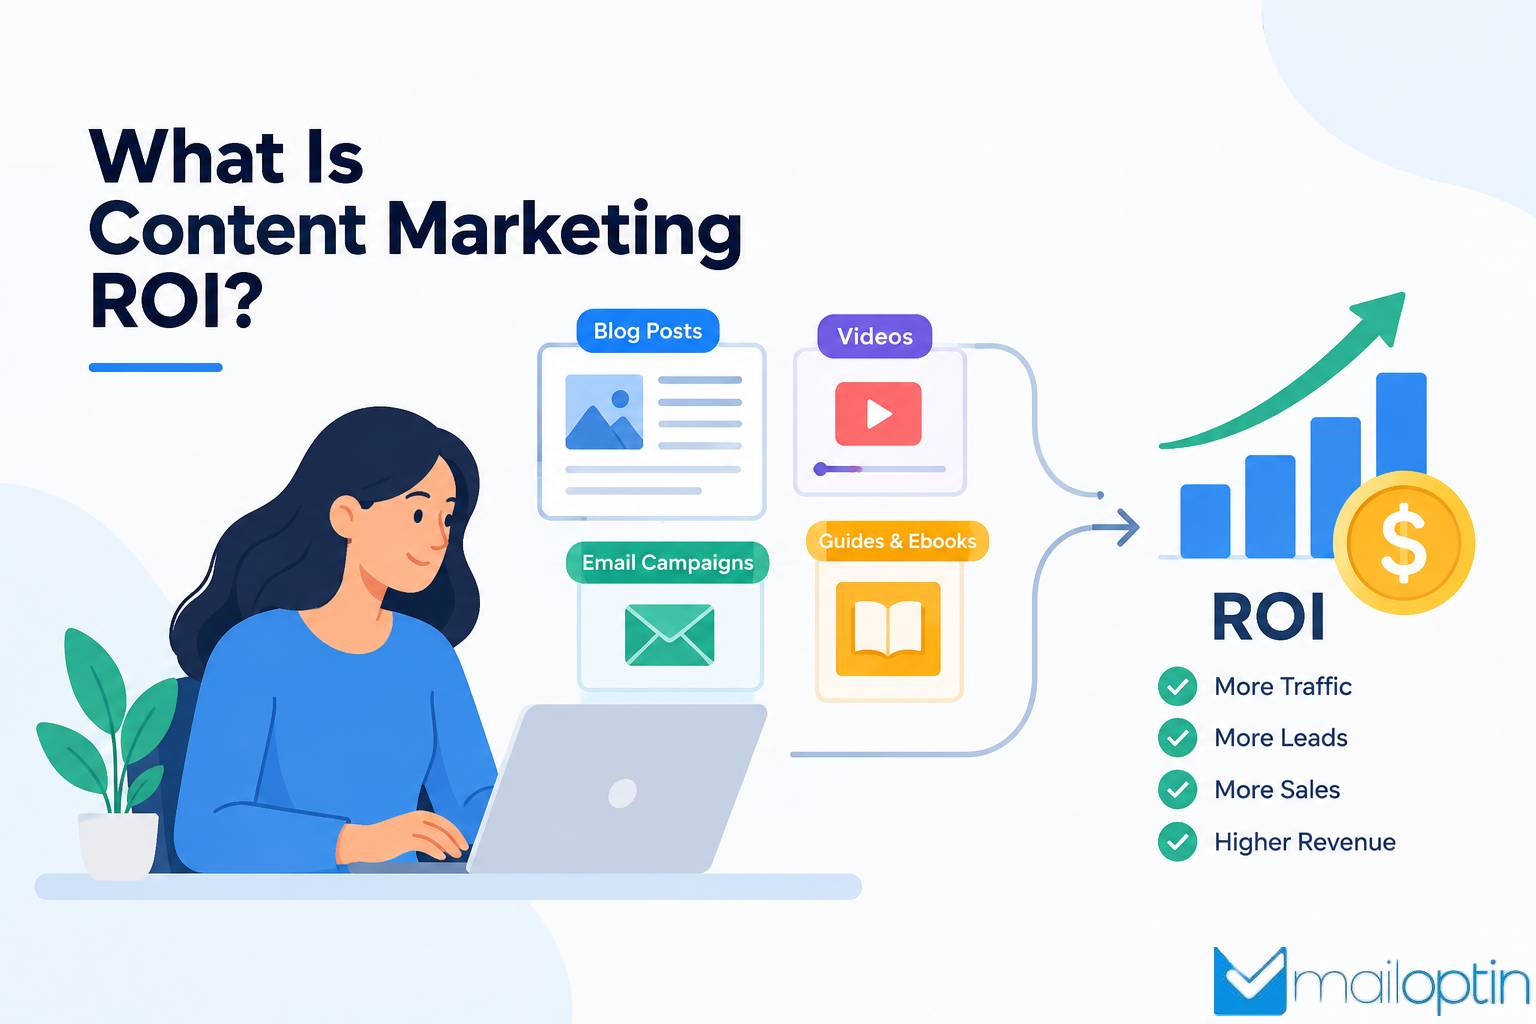
Content marketing ROI measures the financial return your business gets from its content compared with what it spends producing and promoting that content.
A basic formula is:
Content Marketing ROI = (Revenue Generated – Content Cost) ÷ Content Cost × 100
For example, suppose your business spends $2,000 to create and promote blog posts, guides, videos, and other content. If those efforts generate $8,000 in revenue, your calculation would be:
($8,000 – $2,000) ÷ $2,000 × 100 = 300%
This means the content generated a 300% return on the investment.
However, content marketing ROI isn’t always measured only through direct sales. Content can also contribute to:
- Increased organic traffic
- Improved search rankings
- More qualified leads
- Higher customer engagement
- Better brand awareness
- Reduced customer acquisition costs
Therefore, effective measurement requires looking beyond immediate revenue.
Why Measuring Content Marketing ROI Matters
We all know that creating quality content requires time, money, and effort. Whether you publish blog posts, create videos, send newsletters, or produce downloadable guides, your business invests resources in content.
But without measuring the results, it can be difficult to know whether that investment is paying off.
This is why measuring content marketing ROI matters. It helps you connect your content efforts to actual business results instead of relying only on traffic, likes, or page views.
For example, a blog post may attract 10,000 visitors but generate only a few leads. Another article may attract just 2,000 visitors but bring in several paying customers. If you measure only traffic, the first article may look more successful. However, looking at revenue and conversions could tell a very different story.
Measuring the ROI of content marketing also helps you understand which topics, formats, and campaigns are producing better results. You can identify content that generates leads, supports sales, brings returning visitors, or encourages people to sign up for your email list. This information can then guide your future content decisions.
Content also comes with costs. Writing, editing, designing, promoting, and updating content can add up over time. When you compare these costs with the revenue or leads generated, you get a better idea of whether your content investment is worthwhile.
A good content marketing measurement process can help you:
- See which content brings valuable visitors to your website
- Identify pages that generate leads and conversions
- Understand how visitors interact with your content
- Find content that needs updating or improvement
- Compare the performance of different content campaigns
- Track the cost of generating leads and customers
- Connect content with sales and revenue
- Make better decisions about your content budget
Most importantly, measuring ROI helps you move beyond the question, “How much traffic did this content get?” to a more useful one: “What did this content do for the business?”
By tracking the right content marketing metrics, you can see what is working, what is not, and where there is room for improvement. This makes it easier to invest more time and money in content that produces meaningful results.
15 Important Content Marketing Metrics to Measure ROI
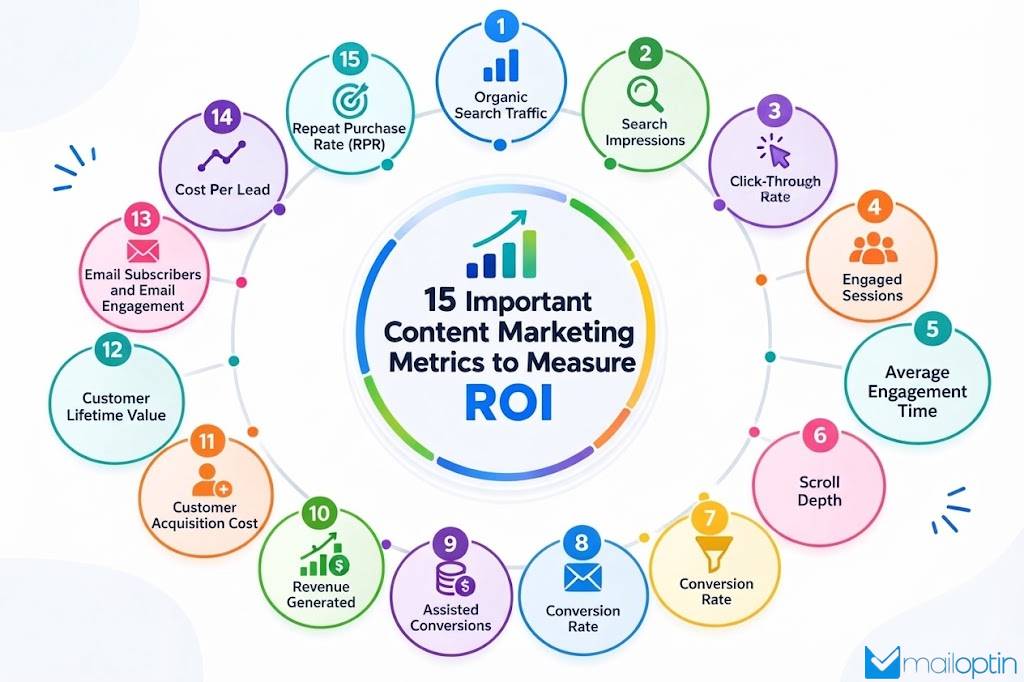
No single metric can tell you whether your content strategy is successful. You need a group of metrics that cover different stages of the customer journey.
Below are 15 metrics to track when you measure content marketing performance.
1. Organic Search Traffic
Organic search traffic is the number of visitors who reach your website through unpaid search results on search engines such as Google and Bing.
Why it matters: Organic search traffic shows how well search discovers your content. When your articles rank for relevant searches, they can bring visitors to your website without you paying for each click. It also helps you see whether your SEO and content efforts are attracting the audience you want.
📍 Find it in GA4
Go to Reports > Acquisition > Traffic acquisition
Look for Organic Search under the session default channel group. You can review:
- Users
- Sessions
- Engagement rate
- Conversions
- Revenue
You can also use Google Search Console to check organic clicks, impressions, average position, and the search queries bringing people to your pages.
How to Interpret It
- Rising traffic means your SEO visibility is growing and your pages are matching search intent.
- Flat traffic with high impressions means people see your listing but don’t click. Your titles and meta descriptions need work.
- High traffic with low engagement means you’re pulling the wrong visitors or your page doesn’t deliver what the headline promised.
Actionable Next Step
Find your pages with the highest organic traffic and check whether they are generating leads or sales. For pages that attract visitors but have few conversions, improve the CTA, add relevant internal links, and place an appropriate lead form or offer where it makes sense.
For pages with high impressions but low CTR, test different titles and meta descriptions to encourage more searchers to click.
2. Search Impressions
Search impressions are the number of times your content appears in search engine results when people search for related terms.
Why it matters: Search impressions show how often your content appears in search results. A growing number of impressions can indicate your pages are gaining visibility and appearing for more relevant searches, even when visitors don’t click through to your website.
📍 Find it in Google Search Console
Performance > Search results
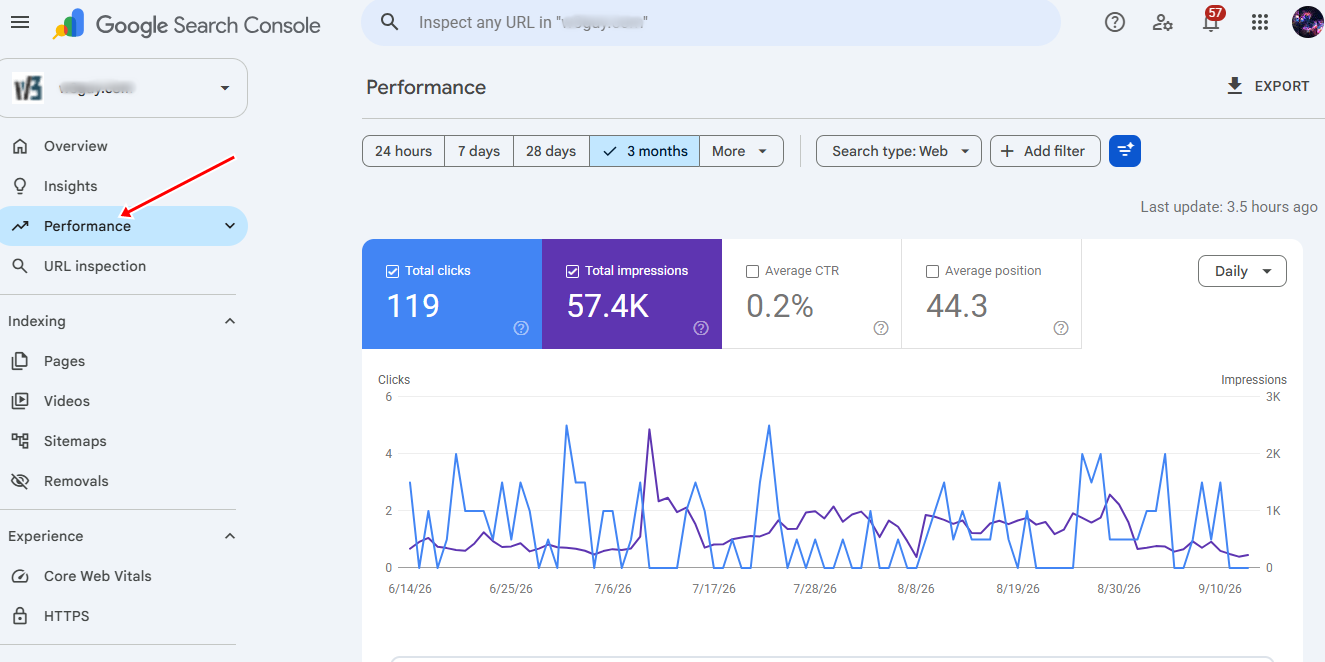
Review:
- Total impressions
- Total clicks
- Average CTR
- Average position
- Search queries
- Top-performing pages
How to Interpret It
- Rising impressions mean your content is gaining visibility for more searches.
- High impressions with low clicks mean your titles and meta descriptions aren’t pulling people in.
- High impressions with low average position mean you’re showing up, but far down the page.
- Falling impressions point to ranking losses or shrinking search demand.
Actionable Next Step
Find pages with high impressions but low CTR and review their titles and meta descriptions. Make them more relevant to the search intent and clearly communicate what readers can expect from the page.
You can also review the search queries generating impressions and update your content to cover relevant topics and questions that your audience is searching for.
3. Click-Through Rate
Click-through rate, or CTR, measures the percentage of people who click your content after seeing it in search results.
The formula is: CTR = Clicks ÷ Impressions × 100
For example, if your page receives 10,000 impressions and 500 clicks:
500 ÷ 10,000 × 100 = 5% CTR
A low CTR may indicate that your page appears in search results but doesn’t give users enough reason to click.
Why it matters: Click-through rate (CTR) shows how effective your search result is at attracting clicks. A page can have high search impressions but receive few visits if its title and meta description don’t give people a reason to click.
📍 Find it in Google Search Console
Performance > Search results
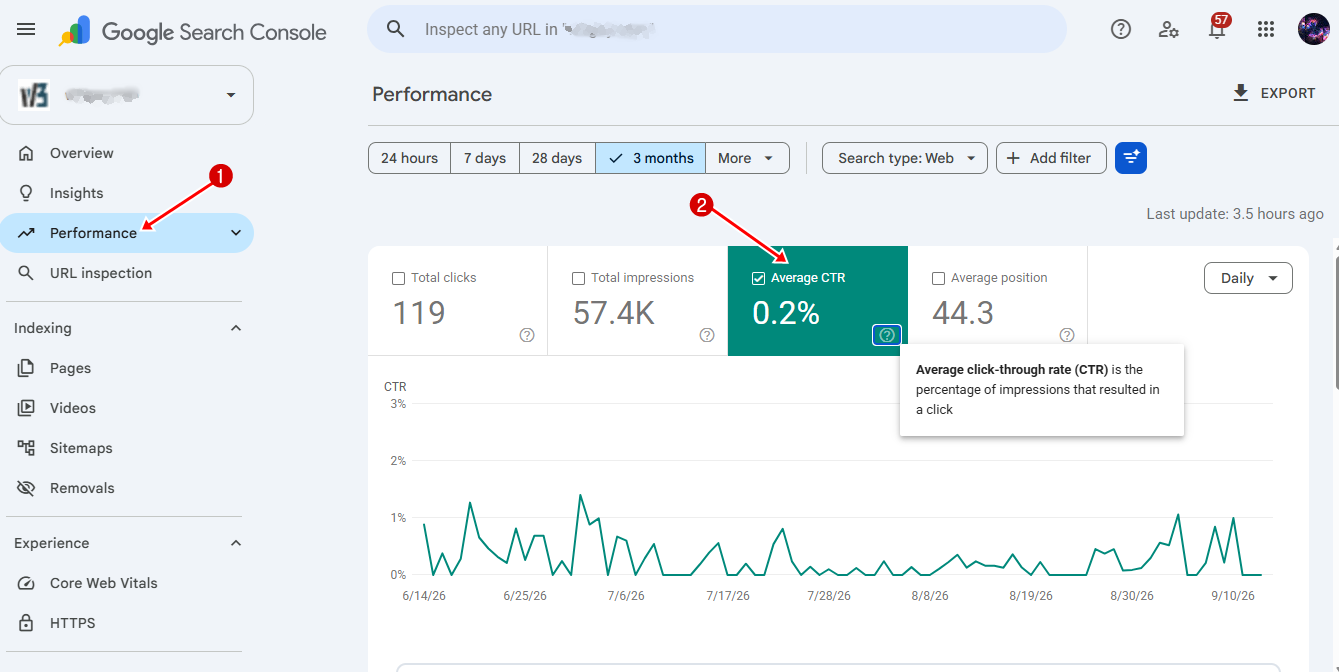
Review:
- Total clicks
- Total impressions
- Average CTR
- Average position
- CTR for individual pages and search queries
How to Interpret It
Rising CTR: Your titles and meta descriptions are doing a better job of encouraging searchers to visit your website.
High impressions with low CTR: Your content is appearing in search results, but your title or meta description may need improvement.
High CTR with low impressions: Your page is appealing to searchers who see it, but it may need better rankings or broader search visibility.
Actionable Next Step
Review pages with high impressions and low CTR, then test clearer and more engaging titles and meta descriptions that match what searchers are looking for.
You can also use relevant numbers, benefits, or specific wording in your titles where appropriate to make your search result more appealing and increase clicks.
4. Engaged Sessions
Engaged sessions refer to the number of website sessions where visitors actively interact with your content. In Google Analytics 4 (GA4), a session is counted as engaged when it lasts longer than 10 seconds, includes a conversion, or records at least two page views or screen views.
Why it matters: Engaged sessions help you understand whether visitors are actually interacting with your content rather than leaving shortly after arriving. A page may attract plenty of traffic, but a high number of engaged sessions suggests visitors find the content useful enough to keep reading, explore other pages, or take action.
📍 Find it in GA4
Reports > Acquisition > Traffic acquisition
Review:
- Engaged sessions
- Engagement rate
- Average engagement time per session
- Events per session
- Conversions
You can also compare engaged sessions for individual landing pages to see which content keeps visitors interested.
How to Interpret It
Rising engaged sessions: Your content is attracting visitors who spend time on your website and interact with your pages.
High traffic but low engaged sessions: Your content may be attracting the wrong audience, or visitors may not be finding what they expected after clicking through from search results.
High engagement with low conversions: Visitors are interested in your content, but your CTA or offer may not give them a clear reason to take the next step.
Low engagement time: Review your introduction, page structure, readability, loading speed, and whether the content matches the visitor’s search intent.
Actionable Next Step
Start by finding pages with high traffic but low engagement. Improve the introduction, break long sections into smaller ones, add relevant images, include internal links, and place useful CTAs where they fit naturally.
5. Average Engagement Time
Average engagement time shows how long visitors actively interact with your website.
Why it matters: It shows whether people are actually reading your content or just landing and leaving. Long engagement time signals that your writing holds attention and answers what readers came for.
📍 Find it in GA4
Reports > Engagement > Pages and screens
Review Average engagement time per page and compare across pages to spot your best and worst performers.
How to Interpret It
- Rising engagement time means your content keeps readers hooked and your layout is easy to follow.
- High traffic with low engagement time means visitors aren’t finding what they expected. Your intro or headline may be overselling.
- Long engagement time on a short page can mean readers are confused and hunting for answers.
- Falling engagement time on a page that used to perform points to stale content or a layout that needs work.
Actionable Next Step
- Rewrite weak intros so readers know within seconds that they’re in the right place.
- Break up long walls of text with subheads, short paragraphs, and visuals.
- Add related posts and internal links to keep readers moving to another page.
- Review your worst-performing pages and ask what’s pushing people away.
- Match your content to the search intent behind the query. If someone wants a quick answer, give it early.
6. Scroll Depth
Scroll depth shows how far visitors scroll through a webpage before leaving. It helps you understand how much of your content users view, such as 25%, 50%, 75%, or 90% of a page.
Why it matters: Scroll depth shows whether visitors read through your content or leave before reaching important sections. This can be especially useful for long-form articles, guides, and landing pages where important information or CTAs appear further down the page.
📍 Find it in GA4
GA4 does not automatically provide detailed scroll-depth percentages for every page. You can track scroll activity through Admin > Data streams > Web > Enhanced measurement or set up custom scroll events through Google Tag Manager.
Review:
- Scroll events
- Page views
- Engagement time
- Conversions
- Landing pages
How to Interpret It
High scroll depth: Visitors are moving through most of your content, which can indicate that the page is holding their attention.
Low scroll depth: Visitors may be leaving before reaching important sections. Check whether the introduction, content structure, page speed, or search intent needs improvement.
High traffic with low scroll depth: Your page attracts visitors, but many leave early. Compare the search query with the content to make sure the page delivers what visitors expect.
High scroll depth with low conversions: Visitors are reaching the end of your content but may not see a clear reason to take action. Review the CTA and offer.
Actionable Next Step
- Move your best points higher on the page.
- Break long sections into smaller chunks with clear subheads so readers keep moving.
- Add visuals, examples, or pull quotes to reset attention at the midway point.
- Test different intros on pages with weak scroll depth and see which one holds people longer.
7. Leads Generated
Leads generated refer to the number of potential customers who take a valuable action after interacting with your content. These actions may include signing up for an email list, filling out a contact form, requesting a demo, or downloading a resource.
Why it matters: Leads show whether your content attracts people genuinely interested in what your business offers. High traffic is useful, but qualified leads give you a better sense of whether your content is contributing to business growth.
📍 Find it in GA4
Go to Reports > Engagement > Events and review the events connected to your lead-generation actions.
You can also check:
- Form submissions
- Newsletter signups
- Downloads
- Demo requests
- Free trial registrations
- Contact form submissions
- Conversions
How to Interpret It
- Rising leads mean your content and calls to action are working together.
- High traffic with few leads means your content informs but doesn’t invite action. Your offers may be weak or missing.
- Falling leads on a page that used to convert points to a broken form, a stale offer, or a drop in traffic quality.
- Leads that never become customers point to a mismatch between what you promised and what you sell.
Actionable Next Step
- Add a clear call to action to every post. Don’t assume readers will know what to do next.
- Match your offer to the topic. A post about budgeting should offer a budgeting template, not a generic newsletter signup.
- Test different placements, wording, and offer types to see what pulls best.
- Send leads into a follow-up sequence so they stay warm instead of going cold.
- Review your lowest-converting pages and ask what would make a reader want to hear from you.
8. Conversion Rate
Conversion rate measures the percentage of visitors who complete a desired action.
The basic formula is:
Conversion Rate = Conversions ÷ Visitors × 100
For example, if 2,000 people visit an article and 80 sign up for your newsletter:
80 ÷ 2,000 × 100 = 4%
Why it matters: Conversion rate shows how well your content turns visitors into leads or customers. A page may receive plenty of traffic, but a low conversion rate can indicate visitors aren’t finding a clear reason to take the next step.
📍 Find it in GA4
Reports > Engagement > Conversions
Review:
- Conversions
- Conversion rate
- Users
- Sessions
- Landing pages
- Traffic sources
You can also compare conversion rates across different articles, landing pages, campaigns, and traffic sources.
How to Interpret It
Rising conversion rate: More visitors are taking the desired action, which can indicate that your content, offer, and CTA are working well together.
High traffic with a low conversion rate: Your content is attracting visitors, but the offer or CTA may not match their needs or intent.
Low traffic with a high conversion rate: The page is attracting fewer visitors but is effective at turning those visitors into leads or customers. Increasing its visibility may bring more conversions.
High engagement with a low conversion rate: Visitors are interested in the content but may not know what to do next. Review your CTA, offer, and page layout.
Actionable Next Step
Find pages with high traffic and low conversion rates, then test different CTAs, offers, headlines, and form placements. Make sure the action you want visitors to take closely matches the content they are reading.
For example, you can use MailOptin to add relevant opt-in forms to high-traffic articles and encourage readers to join your email list. Track the conversions from these forms to see which pages and offers generate the best results.
Improving conversion rate can increase the value of your existing traffic without requiring you to attract more visitors.
9. Assisted Conversions
Assisted Conversions measure how often your content played a part in a sale or lead without getting credit for the final click.
A buyer may read three blog posts, watch a video, and join your email list before they ever reach your checkout page.
None of those touchpoints closed the deal on their own, but the sale wouldn’t have happened without them. Assisted conversions count those quiet contributions. They show how often your content appears somewhere along the path to purchase, even when another channel gets the last click.
Why it matters: Last-click reporting hides most of your content’s value. If someone reads your posts for weeks and then buys after clicking a paid ad, the ad gets the credit, and your content gets nothing. Assisted conversions correct that blind spot. They reveal the posts, pages, and videos that warm people up before the sale.
📍 Find it in GA4
Reports > Advertising > Attribution > Conversion paths
Review the touchpoints listed before each conversion. Look for organic and direct visits that appear alongside paid channels
Compare assisted conversions against last-click conversions to see the gap
How to Interpret It
- A high number of assisted conversions means your content is doing real work behind the scenes.
- Content that assists often but never closes is still valuable. It’s warming buyers for other channels.
- A large gap between assisted and last-click numbers means your current attribution model is undervaluing content.
- Pages that show up in many conversion paths deserve more investment, even if they don’t convert directly.
Actionable Next Step
- Report assisted conversions alongside last-click numbers so leadership sees the full picture.
- Identify the pages that assist most often and update them, promote them, and link to them more.
- Build follow-up sequences for readers who engage with those pages but haven’t bought yet.
- Use a multi-touch attribution model, so your content gets fair credit.
10. Revenue Generated
Revenue generated measures how much money your business earns from customers who interacted with your content before completing a purchase or becoming a paying customer.
It helps connect content marketing activities to actual sales rather than stopping at traffic, engagement, or lead generation.
For example, someone may find your website through a blog post, read a product comparison, visit your pricing page, and return later to make a purchase. If your analytics setup can connect those interactions, you can see how the content contributed to the revenue.
Why it matters: Revenue gives you a clearer view of your content’s financial value. A page does not need to generate a sale immediately to be useful. It may introduce potential customers to your business, answer their questions, build trust, or help them compare their options before they eventually buy. Tracking revenue helps you identify the content that contributes to sales and gives you a better basis for calculating your content marketing ROI.
📍 Find it in Google Analytics
Reports > Monetization > Ecommerce purchases
For lead-based businesses, you can also connect GA4 with your CRM or sales system to track revenue from leads generated through your content.
Review:
- Purchase revenue
- Total revenue
- Conversions
- Landing pages
- Traffic sources
- Content-assisted conversions
How to Interpret It
Rising revenue from content: Your content is contributing to more sales and generating greater financial value for the business.
High traffic but low revenue: Your content may be attracting visitors who aren’t ready to buy, or the page may not provide a clear path to your products or services.
Low traffic but high revenue: A smaller amount of highly relevant traffic can sometimes produce better financial results than a large volume of visitors with little buying intent.
High assisted revenue: Your content may be influencing customers earlier in their buying journey, even when another page receives the final conversion credit.
Actionable Next Step
Identify the articles, guides, landing pages, and other content that are connected to the highest revenue. Look for common topics, formats, and customer needs, then create or update related content around those areas.
Add relevant CTAs and internal links that guide readers toward products, services, pricing pages, or other conversion opportunities. Once you have reliable revenue data, compare it with your content production and promotion costs to calculate content marketing ROI and determine which content deserves more investment.
11. Customer Acquisition Cost
Customer Acquisition Cost (CAC) is the average amount your business spends to gain a new paying customer. When measuring content marketing, this can include the cost of writing and editing content, creating graphics or videos, promoting articles, running paid campaigns, and paying for marketing subscriptions.
Comparing these expenses with the number of customers gained through your content helps you understand how much you spend to turn content-driven prospects into paying customers.
Why it matters: CAC helps you determine whether your content is bringing in customers at a reasonable cost. If your content generates plenty of leads but acquiring each customer costs more than the revenue they produce, you may need to change your strategy.
A lower CAC, especially when combined with a healthy customer lifetime value, can indicate that your content is helping the business acquire customers more efficiently.
📍 Find it by calculating it from your marketing and sales data
There’s no built-in report for this. You’ll calculate it yourself.
Customer Acquisition Cost = Total Customer Acquisition Costs ÷ Number of New Customers
Pull your total new customers from GA4 > Reports > Engagement > Conversions or your CRM.
Add up your full content spend for the same period, then divide total spend by new customers to get your acquisition cost.
How to Interpret It
- A falling acquisition cost means your content is getting more efficient at winning customers.
- A rising cost means you’re spending more for the same result. Something in your funnel needs attention.
- A high cost against a high customer lifetime value is fine. You’re paying more upfront but earning it back over time.
- A low cost with low customer quality is a trap. Cheap customers who never buy again aren’t a win.
Actionable Next Step
- Track this number every month so you catch drift early.
- Compare it against your customer lifetime value. If acquisition costs more than a customer returns, fix the funnel or cut the spend.
- Focus your effort on the pages and channels that bring in customers at the lowest cost.
- Reuse and update old content instead of always starting fresh. It lowers your cost per customer.
12. Customer Lifetime Value
Customer Lifetime Value (CLV or LTV) is the estimated revenue a customer will bring to your business over the entire time they remain a customer.
It goes beyond the first purchase and considers repeat purchases, subscription payments, renewals, upgrades, and other revenue a customer may generate over time. For content marketing, LTV helps you understand whether the customers attracted through your content continue to provide value after their first conversion.
Why it matters: A customer who makes a small first purchase may become far more valuable if they continue buying from you for several years. Looking only at the first sale could make your content appear less profitable than it really is. Comparing customer lifetime value with your acquisition costs gives you a better idea of whether your content marketing ROI is sustainable over time.
📍 Find it in your CRM, ecommerce platform, or GA4
There’s no ready-made report for this. You’ll build it from a few sources.
Pull average order value from Reports > Monetization > Ecommerce purchases
Get purchase frequency and customer lifespan from your CRM or shop platform. Multiply average order value by purchase frequency by average lifespan.
The Formula is: LTV = Avg. Order Value × Purchase Frequency × Customer Lifespan
How to Interpret It
Rising customer lifetime value: Customers are spending more or staying with your business for longer, increasing the potential return from your content marketing efforts.
Low LTV with high acquisition costs: You may be spending too much to acquire customers who do not generate enough revenue over time.
High LTV with low CAC: This is a positive sign that your content attracts customers who provide significant value relative to the cost of acquiring them.
Increasing LTV from content-driven customers: Your content may be attracting people who are a good fit for your products or services and are more likely to remain customers.
Actionable Next Step
Compare the lifetime value of customers who interact with your content with that of customers acquired through other marketing channels. Pay attention to the topics, articles, and campaigns associated with customers who make repeat purchases or remain subscribed for longer.
You can then create more content that addresses the needs of these valuable customers. Educational guides, product tutorials, comparison articles, and helpful email content can keep customers engaged and encourage them to return, renew, or make additional purchases.
13. Email Subscribers and Email Engagement
This covers two related things. First, the number of people who joined your email list by choice, usually after reading your content and deciding they want more.
Second, how those subscribers interact with the emails you send them, measured through opens, clicks, unsubscribes, and spam complaints.
A growing list is good, but an engaged list is better. A thousand subscribers who never open your emails are worth less than two hundred who read every one and click through often. Together, these numbers show whether your content pulls people into your world and whether your emails keep them there.
Formula
Open Rate = Opens ÷ Delivered × 100
CTR = Unique Clicks ÷ Delivered × 100
Why it matters: Email drives retention and repeat revenue. It costs far less to re-engage someone already on your list than to win a brand new visitor. Content brings people in, and email keeps them close. When both work, you build an audience you own instead of renting one from search engines or social platforms.
📍 Find it in GA4/ESP
- GA4: Reports > Acquisition > User acquisition (if your email platform is connected)
- ESP (Mailchimp, HubSpot, Brevo): Campaign reports > Opens and Clicks
- Pair with GA4 Retention to see how email affects return visits and purchases
How to Interpret It
- Benchmarks: 20 to 30% open rate is typical; 2 to 5% CTR is solid.
- Beware: Apple Mail Privacy Protection inflates open rates. Treat them as a loose signal.
- Track trends over time instead of fixating on absolutes.
- Rising unsubscribes after a campaign mean your message missed the mark or your list expectations don’t match what you send.
- High opens with low clicks mean your subject lines work, but your content or offer doesn’t pull people further.
Actionable Next Step
- Test subject lines and send times to see what your audience responds to.
- Use segmented popups based on on-site behavior to capture leads who are more likely to click.
- Build win-back sequences for subscribers who’ve gone quiet.
- Give new subscribers a clear reason to stay, such as a welcome series that delivers real value fast.
- Clean your list now and then. Removing dead weight improves your numbers and your sender reputation.
14. Cost Per Lead
Cost Per Lead (CPL) measures how much your business spends, on average, to generate a new lead through your content marketing efforts. The calculation can include expenses such as content creation, editing, design, promotion, advertising, email marketing, and other costs directly related to attracting potential customers.
For example, if you spend $2,000 creating and promoting content and generate 200 leads, your cost per lead is $10.
Formula:
Cost Per Lead = Total Content Marketing Cost ÷ Number of Leads Generated
Why it matters: Cost per lead helps you understand how efficiently your content is generating potential customers. A campaign that brings in hundreds of leads may look successful, but those leads can become expensive if you spend too much to acquire them.
Tracking CPL alongside lead quality, conversion rate, and sales helps you see whether your content is bringing in valuable prospects at a reasonable cost.
📍 Find it in your analytics, advertising platform, or CRM
Review your total content and promotion costs, then compare them with the number of leads generated during the same period.
Review:
- Total content marketing costs
- Leads generated
- Lead conversion rate
- Qualified leads
- Customers generated from leads
How to Interpret It
Falling CPL: You are generating leads at a lower cost, which can indicate that your content and promotional efforts are becoming more efficient.
Rising CPL: Your content is costing more to produce or promote without generating enough additional leads.
Low CPL with poor-quality leads: A low cost does not always mean good results. If most leads never become customers, review your targeting and content.
High CPL with valuable customers: Paying more per lead may still make sense if those leads have a high chance of becoming paying customers and generating enough revenue.
Actionable Next Step
Compare the cost per lead across different content types, campaigns, and traffic sources. Look for content that generates qualified leads at a lower cost and create more content around topics that attract similar prospects.
You can also improve your CPL by updating existing content that already receives traffic, improving your CTAs, and adding relevant lead forms. MailOptin can help capture visitors through targeted opt-in campaigns.
15. Repeat Purchase Rate (RPR)
Repeat Purchase Rate (RPR) is the percentage of customers who make more than one purchase from your business during a specific period. It helps you see whether your content and marketing efforts are attracting customers who return to buy again, rather than customers who make a single purchase and never come back.
For example, if 500 customers bought from your business during a year and 125 of them made another purchase, your repeat purchase rate would be 25%.
Formula:
Repeat Purchase Rate = Repeat Customers ÷ Total Customers × 100
Why it matters: Repeat customers can contribute significantly to your overall revenue because you have already spent money and effort acquiring them.
When customers return to purchase again, your business can generate more revenue without paying the full acquisition cost again. Tracking RPR can therefore help you understand whether your content, email campaigns, product experience, and follow-up efforts encourage customers to stay engaged with your business.
📍 Find it in GA4
Reports > Monetization > Ecommerce purchases
For ecommerce websites, review purchase events and returning customers. You can also connect your analytics data with your CRM or ecommerce platform for a clearer view of repeat purchases.
Review:
- Total customers
- Repeat customers
- Purchase events
- Returning users
- Revenue from repeat customers
- Average order value
- Repeat purchase rate
How to Interpret It
Rising RPR: More customers are returning to make additional purchases, which can indicate that your retention and follow-up efforts are working.
Declining RPR: Fewer customers are coming back, which may point to weak follow-up campaigns, poor customer experience, or a lack of relevant offers.
High RPR from a specific content source: Content from that source may be attracting customers who are more likely to return. Consider creating more content around similar topics or customer needs.
Low RPR with high first-time sales: Your content may attract new customers but may not do enough to keep them engaged after their first purchase.
Actionable Next Step
- Launch loyalty or referral programs to give customers a reason to return.
- Trigger win-back campaigns after a set number of days of inactivity.
- Build post-purchase email sequences that teach, help, and gently invite the next purchase.
- Study which content sources bring your most loyal customers and invest more there.
How to Improve Content Marketing ROI
Measuring your ROI is only half the job. The other half is making it better. The good news is that improving content ROI rarely means working harder. It usually means working on the right things and cutting what doesn’t earn its keep.
Here’s how to do it.
1. Focus on Content That Generates Revenue: Traffic is useful, but revenue gives you a clearer view of your content’s business value.
Review your analytics to find articles and landing pages that contribute to leads, sales, or assisted conversions. Look for patterns in the topics and formats that perform well.
For example, if comparison articles consistently generate customers, consider creating more comparison content around products or services your audience is researching.
2. Improve Pages With High Traffic but Low Conversions: A page receiving thousands of visitors but generating very few leads is a good place to look for improvement.
Check whether the CTA matches the article topic. The offer should make sense based on what the reader is currently learning.
You can test:
- CTA wording
- Button placement
- Lead forms
- Content upgrades
- Product recommendations
- Free trials
- Newsletter signup offers
Small changes to a high-traffic page can increase conversions without requiring you to attract more visitors.
3. Create Content Around Search Intent: Getting your content to rank is not enough. It also needs to answer what the searcher actually wants.
Before creating an article, consider whether the person searching wants information, is comparing options, is solving a problem, or is preparing to make a purchase.
When your content matches that intent, visitors are more likely to stay, explore other pages, and take action.
4. Strengthen Your Calls to Action: Every piece of content should have a logical next step when appropriate.
An educational article might direct readers to a related guide. A product comparison could link to a product page, while a tutorial could encourage readers to try a related service.
Avoid using the same CTA everywhere. Make the action relevant to the content and the reader’s place in the buying journey.
5. Build Better Internal Links: Internal links help visitors discover related content and move through your website.
For example, an article about email marketing could link to a guide about building an email list, which could then link to a relevant product or service page.
This creates a natural path from informational content toward conversion pages. It can also help search engines discover and understand related pages on your website.
6. Improve Email Follow-Up: Content can attract a visitor today, but email can give you another opportunity to bring that person back later.
Use useful articles, guides, product updates, and relevant offers to keep subscribers engaged. MailOptin can help you collect email subscribers through targeted opt-in campaigns and send newsletters or automated emails based on your content strategy.
7. Reduce Unnecessary Content Costs: Improving ROI is not only about increasing revenue. Reducing unnecessary spending can also improve your return.
Review how much you spend on writing, editing, design, promotion, and other content activities. If a particular type of content consistently produces little traffic, few leads, and no meaningful revenue, consider whether it deserves the same level of investment.
At the same time, don’t cut content just because it doesn’t generate immediate sales. Some content plays an important role earlier in the customer journey.
8. Keep Measuring and Testing: Content performance can change over time. Search rankings, audience interests, competitors, and conversion rates can all affect your results.
Review your content marketing metrics regularly and test changes rather than relying on assumptions. Compare your results before and after updating a page, changing a CTA, improving an email campaign, or creating content around a new topic.
The goal is to create a cycle of measure, improve, test, and repeat. Over time, this approach can help you get more leads, customers, and revenue from the content you already produce.
Maximize Your Content Marketing Impact with MailOptin
Everything in this guide comes down to one goal: turning readers into leads and customers. Traffic, rankings, and engagement only pay off when people take the next step. That’s where MailOptin comes in.
MailOptin is a popup maker, form builder, and email newsletter plugin for WordPress. It helps you capture emails, grow your marketing list, and keep your audience close, all from one place. The work you put into content brings people to your site. MailOptin makes sure they don’t just leave.
Below are a few ways MailOptin can complement the main content marketing metrics we’ve discussed:
1. Turn Organic Traffic Into Leads: Organic traffic tells you how many people are finding your content through search engines. But getting visitors to your website is only part of the job. You also want to give those visitors a reason to stay connected with your business.
MailOptin lets you add opt-in forms to your blog posts and pages using different formats, including lightbox popups, in-post forms, sidebar forms, notification bars, and slide-ins. You can use these forms to invite visitors to join your email list while they are reading your content.
This lets you turn some organic traffic into subscribers instead of losing visitors when they leave your website.
2. Capture Leads From Engaged Visitors: Engaged sessions, average engagement time, and scroll depth can tell you whether visitors are interacting with your content. When someone spends time reading an article or scrolls through most of the page, they’re more likely to respond to a relevant offer.
MailOptin includes display triggers that let you decide when an opt-in campaign should appear. For example, you can display a form after a visitor has spent a certain amount of time on your site or scrolled through a specific percentage of an article.
This helps you avoid showing a signup form before visitors have had a chance to engage with your content.
3. Improve Your Conversion Rate: A page can receive plenty of traffic and still generate very few leads. In this case, your conversion rate can show that visitors aren’t taking the action you want.
MailOptin gives you different ways to test and improve your opt-in campaigns. Its A/B testing feature allows you to compare different versions of a campaign and see which performs better.
You can experiment with headlines, messages, form designs, and other elements to find an approach that encourages more visitors to subscribe.
4. Build Long-Term Value From Email Subscribers: A visitor who reads a single article may never return. An email subscriber gives you another opportunity to bring that person back to your website.
MailOptin can automatically send new post notifications to your subscribers whenever you publish new content. You can also create email digest campaigns that send a collection of your latest posts on a daily, weekly, or monthly schedule.
This helps extend the value of your content beyond its initial publication and gives subscribers more opportunities to interact with your website.
5. Connect Leads With Your Email Platform: MailOptin integrates with many email marketing platforms and CRMs, including Mailchimp, HubSpot, ActiveCampaign, Brevo, Klaviyo, Kit, Constant Contact, GetResponse, Sender, and others.
This means you can send leads collected through your WordPress website to your preferred email platform for ongoing communication.
6. Make Better Decisions With Campaign Data: MailOptin provides analytics that can help you understand how your opt-in campaigns perform. You can use this information alongside your Google Analytics data to see which pages attract visitors, which campaigns generate subscribers, and where you can improve.
For example, if one article receives plenty of organic traffic but generates very few subscribers, you can test a different opt-in message or placement. If another article generates subscribers at a higher rate, you can study what makes it work and apply similar ideas to related content.
7. It Raises Repeat Purchase Rate: For shops, MailOptin syncs with WooCommerce. You can show upsells when a product is added to the cart, target customers by what they’ve purchased, and offer cross-sells based on cart value.
Here’s the thing. You can write great content, rank well, and still see weak returns if readers have no clear path. MailOptin closes that gap. It turns your traffic into an audience you own, and an owned audience is what makes content ROI climb year after year.
Get MailOptin today. Set up a slide-in on your best posts and an exit-intent popup on your highest-traffic pages. Watch your list grow. Then expand from there.
FAQs About Content Marketing ROI
Q1. What is a good content marketing ROI?
No single number fits every business. A ratio of 3:1, meaning you earn three dollars for every dollar spent, is a solid target for many. Some teams run much higher once their content library matures. What matters more is the trend. If your ROI is climbing quarter over quarter, you’re on the right track.
Q2. How long before content marketing shows ROI?
It depends on your channel, your niche, and how much you publish. Paid ads show returns in days. Content usually takes longer. Most businesses start seeing meaningful traffic within three to six months. Leads and revenue often follow between six and twelve months. Some posts keep earning for years after you publish them, so the early wait pays off later.
Q3. Should I count organic traffic as ROI?
No. Traffic is a signal, not a return. It only becomes ROI when those visitors take an action that brings value, like joining your list, booking a call, or buying something. Traffic tells you your content is visible. Conversions tell you it’s working.
Q4. What if my content gets traffic but no leads?
That’s a conversion problem, not a content problem. Check your calls to action. Are they clear? Are they placed where readers will see them? Does your offer match what the post is about? A post about email marketing should offer an email template, not a generic newsletter signup. Fix the path, and the leads usually follow.
Q5. How often should I review content ROI?
Monthly for a quick check on leads and engagement. Quarterly for a deeper review of revenue, cost per lead, and what to cut or double down on. Yearly to look at the big picture and set next year’s budget.
Q6. Is content marketing worth it if the ROI takes so long?
Yes, if you plan for the wait. Content builds an asset you own. Ads stop working the moment you stop paying. A well-ranked post can bring in leads for years. The businesses that win at content are the ones that stay consistent long enough to see the compounding effect.
Q7. What’s the fastest way to improve content ROI?
Update what you already have. Old posts that once performed well often just need fresher data, a better title, and better internal links. This costs less than writing something new and usually shows results faster. After that, focus on conversion paths and list building.
Q8. How does email fit into content ROI?
Email is where content pays off. A visitor who reads one post and leaves may never return. A visitor who joins your list can be reached again and again at almost no extra cost. That’s why plugins like MailOptin matter. They turn traffic into an audience you own, and an owned audience is what makes content ROI climb.
Q9. What is the difference between content marketing ROI and content marketing metrics?
Content marketing metrics are individual measurements that show how your content performs. Examples include traffic, impressions, engagement time, leads, and conversions.
Content marketing ROI goes further by connecting those results to the money spent on content. Metrics tell you what happened, while ROI helps you understand whether the financial return justified the investment.
Final Thoughts on Content Marketing ROI
Content marketing can bring traffic, leads, and sales, but you need the right data to understand whether your efforts are paying off. Tracking your content marketing ROI helps you connect the time and money spent on content with the results it produces.
Start by monitoring important metrics such as organic traffic, search impressions, engagement, leads, conversion rate, email subscribers, customer acquisition cost, and revenue. These numbers can show you which content is working and where there is room for improvement.
Once you know what is driving results, focus on updating valuable content, improving calls to action, targeting the right search intent, building internal links, and reducing unnecessary content costs. You can also use email marketing to bring visitors back and create more conversion opportunities.
The goal is not to create more content just for the sake of publishing. It is to create content that supports your business goals and produces measurable results.
Keep checking your numbers, learn from what works, and make changes when needed. Over time, this approach can help you get more value from your content and improve your content marketing ROI.