How to View Optin Campaign Reports in Google Analytics
When integrated with Google Analytics, MailOptin allows you to view advanced reporting and detailed data on how your lead capture or optin campaigns are performing.
This guide will show you how to connect MailOptin with your Google Analytics account and where to find impression, conversion and top-performing page statistics.
Connecting MailOptin with Google Analytics
Firstly, ensure you’ve installed your website’s Google Analytics tracking code. If you haven’t, follow our guide on how to install your tracking code on WordPress.
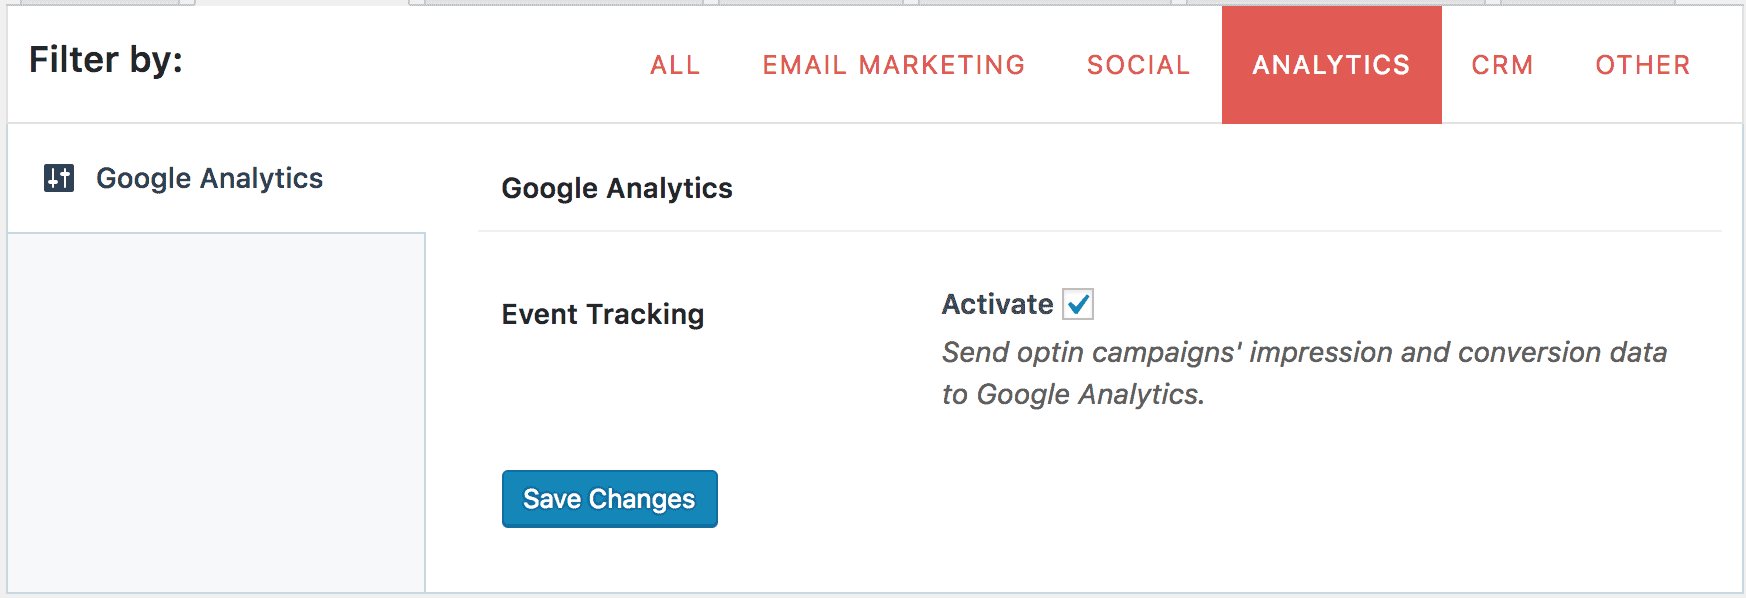
In your WordPress dashboard, Go to the Integrations page by clicking “Integrations” in the MailOptin menu.
Open the Google Analytics section, check Activate and save the change.
To view the optin campaign reports in Google Analytics Dashboard, You can log into your Google Analytics account.
Google Analytics 4
Navigate to Reports » Life cycle >> Engagement » Events.
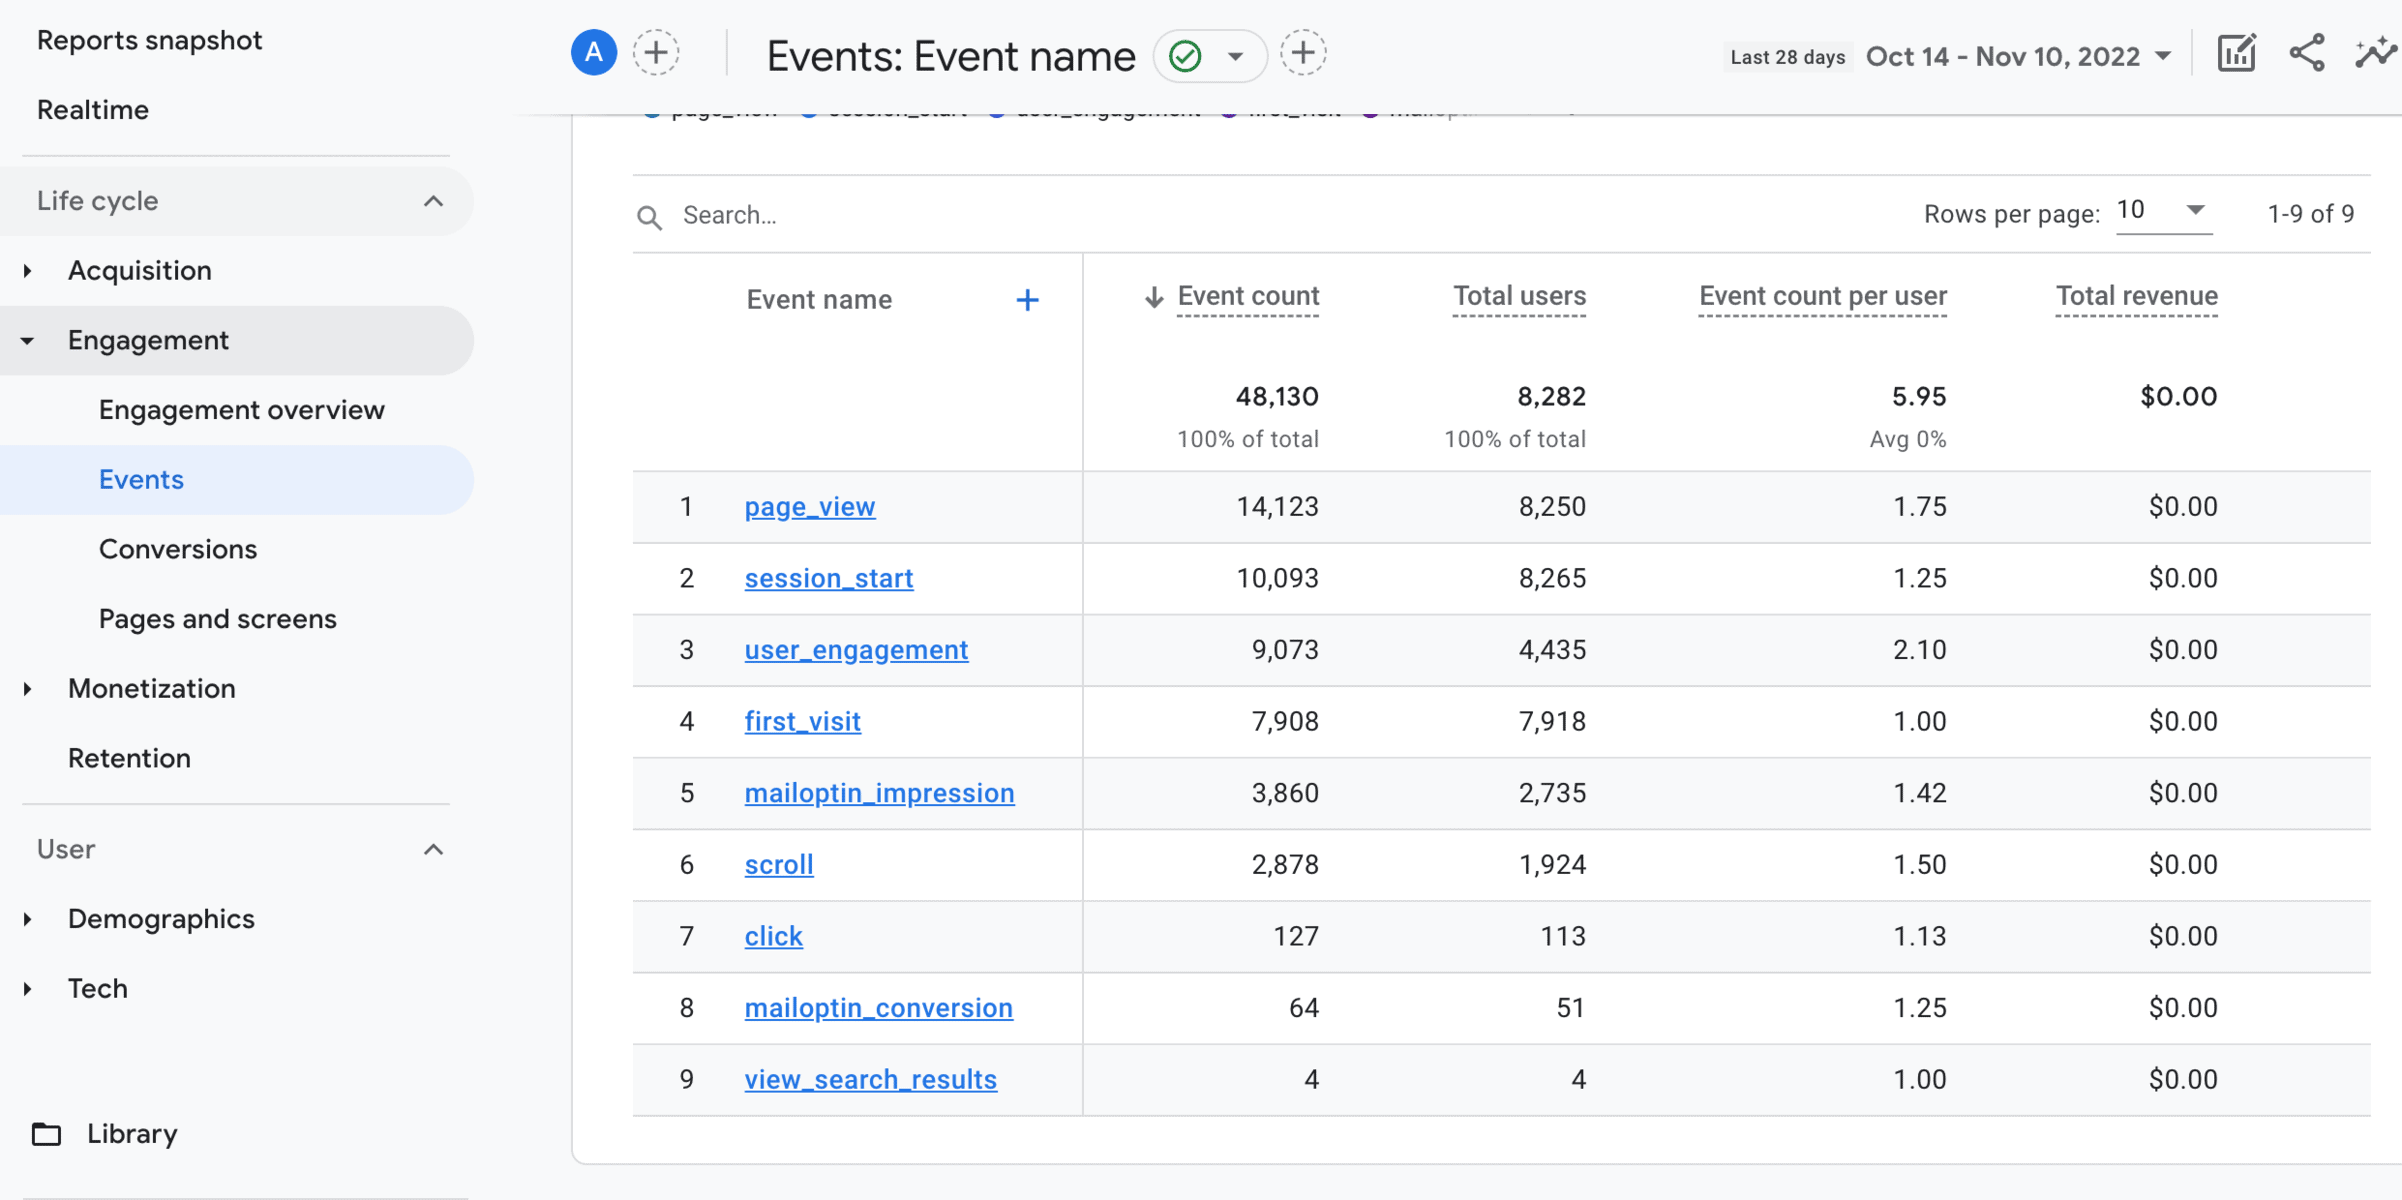
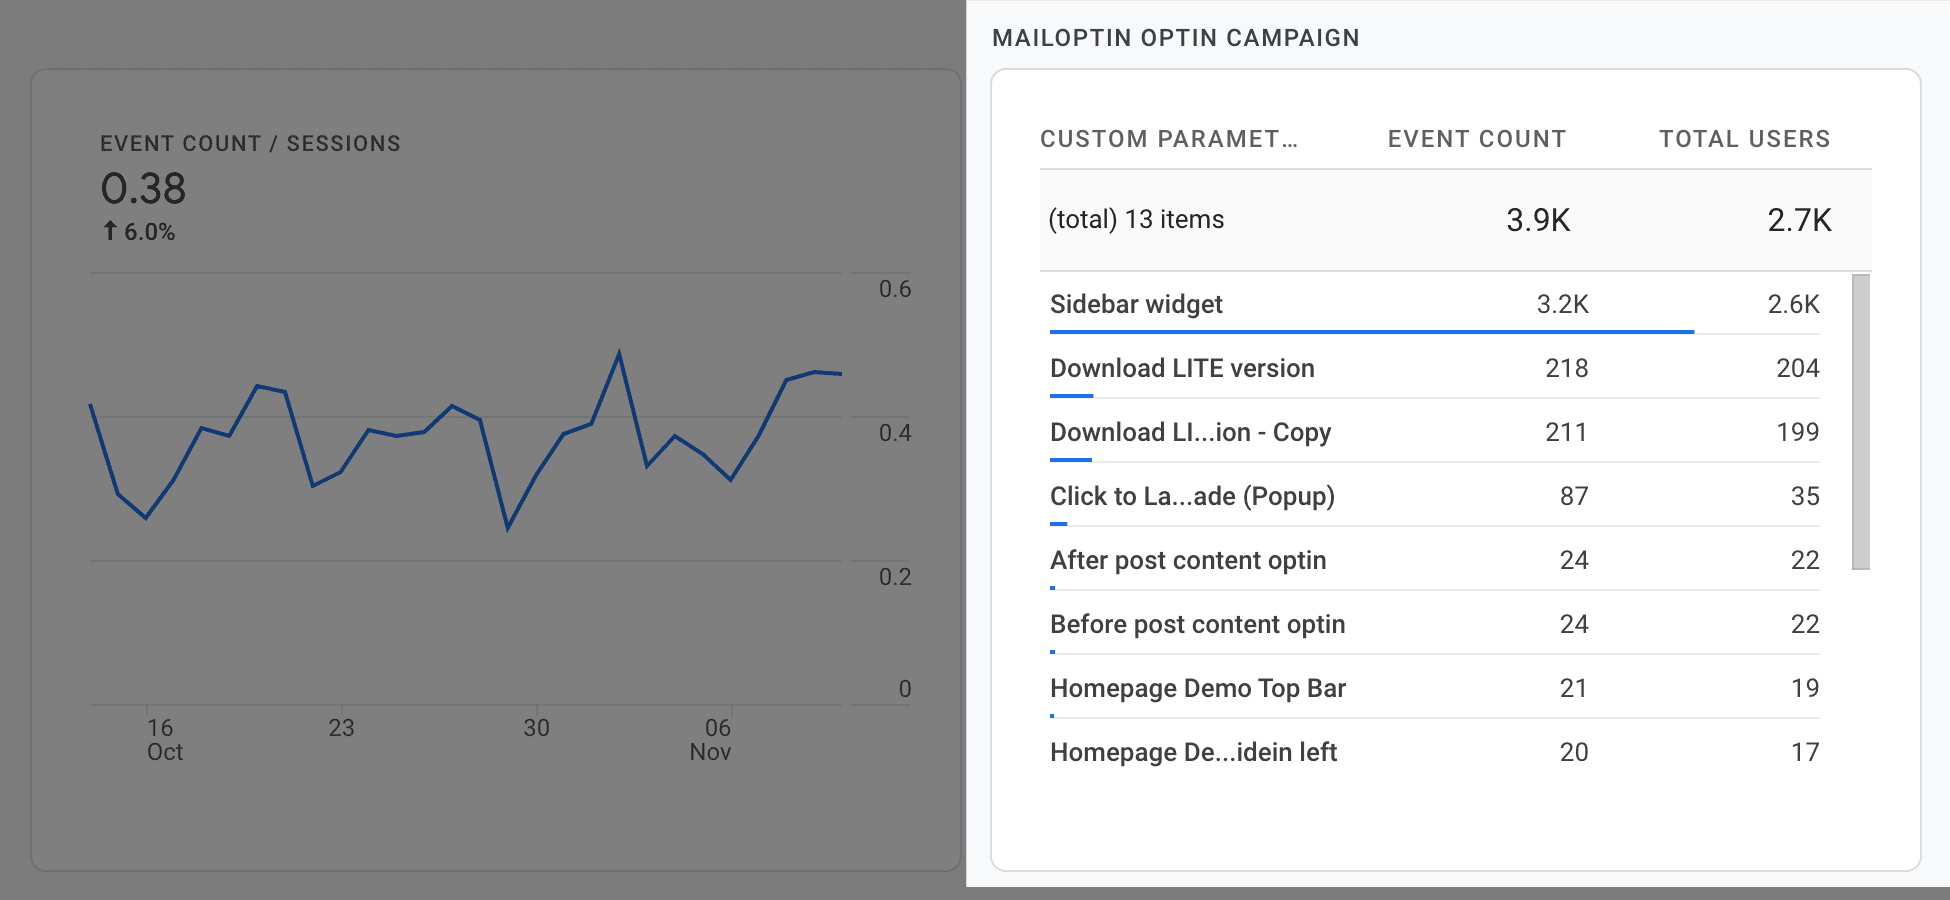
To view your optin campaign impressions, click on the “mailoptin_impression” event to see a list of your optin campaigns and reported appearances.
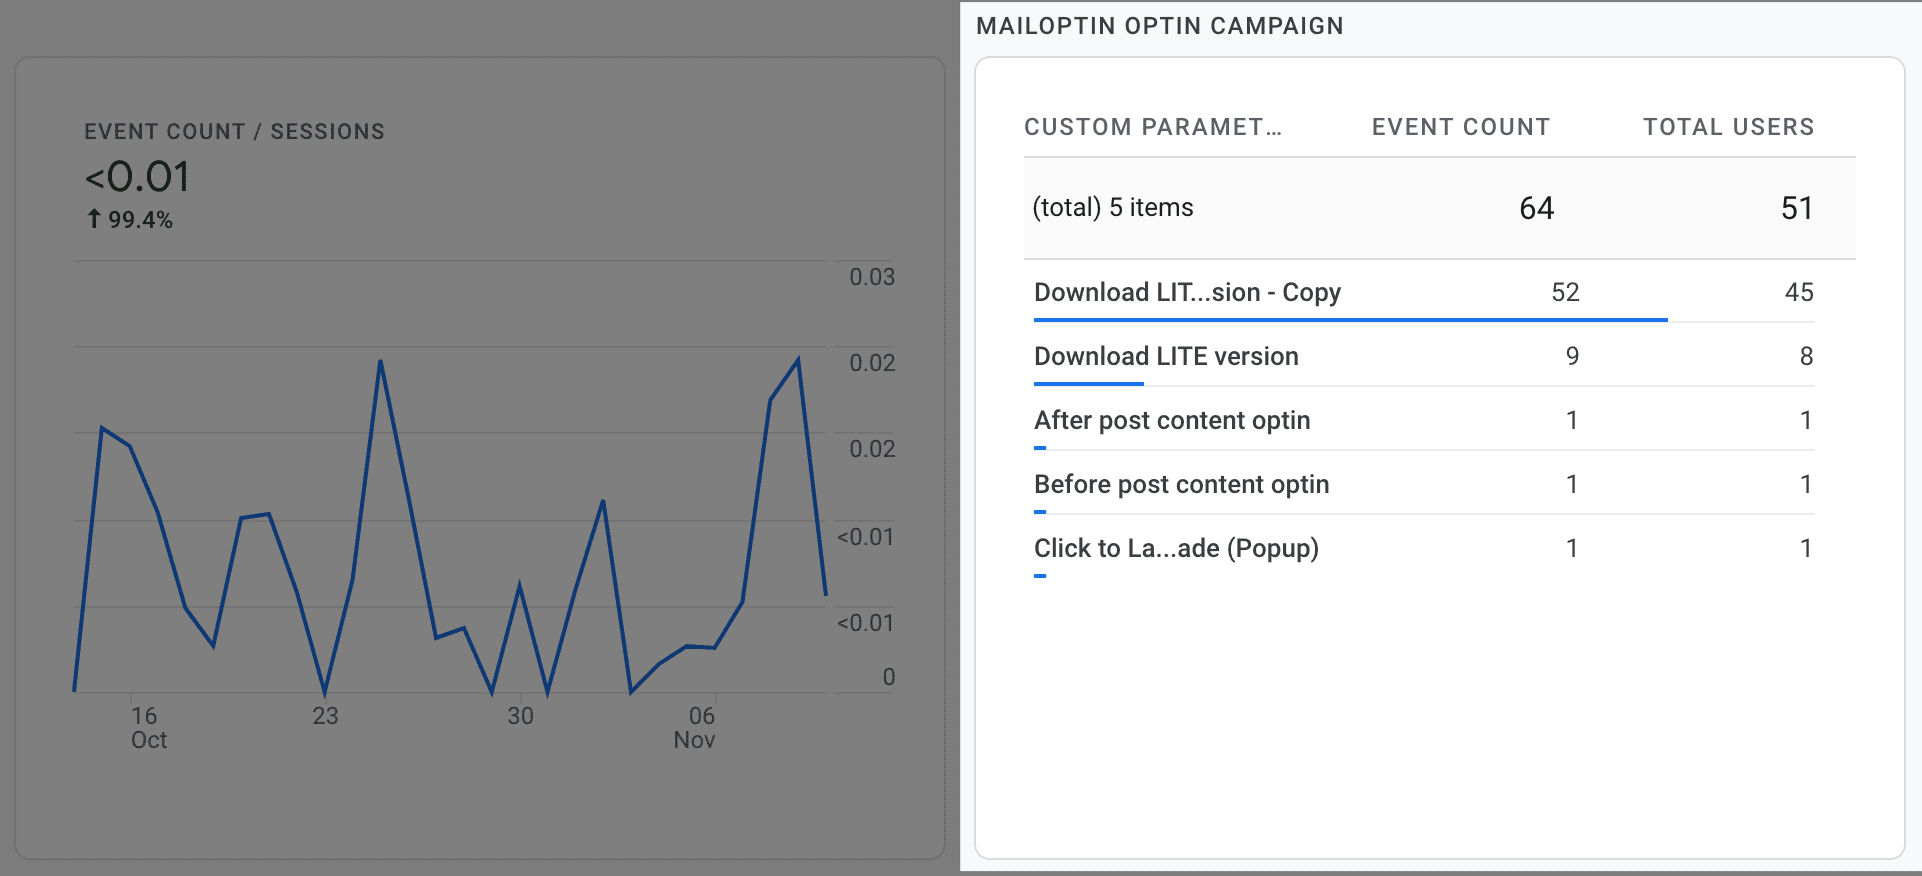
To see a report of your optin campaign conversions, on the Events page. Click on “mailoptin_conversion“.
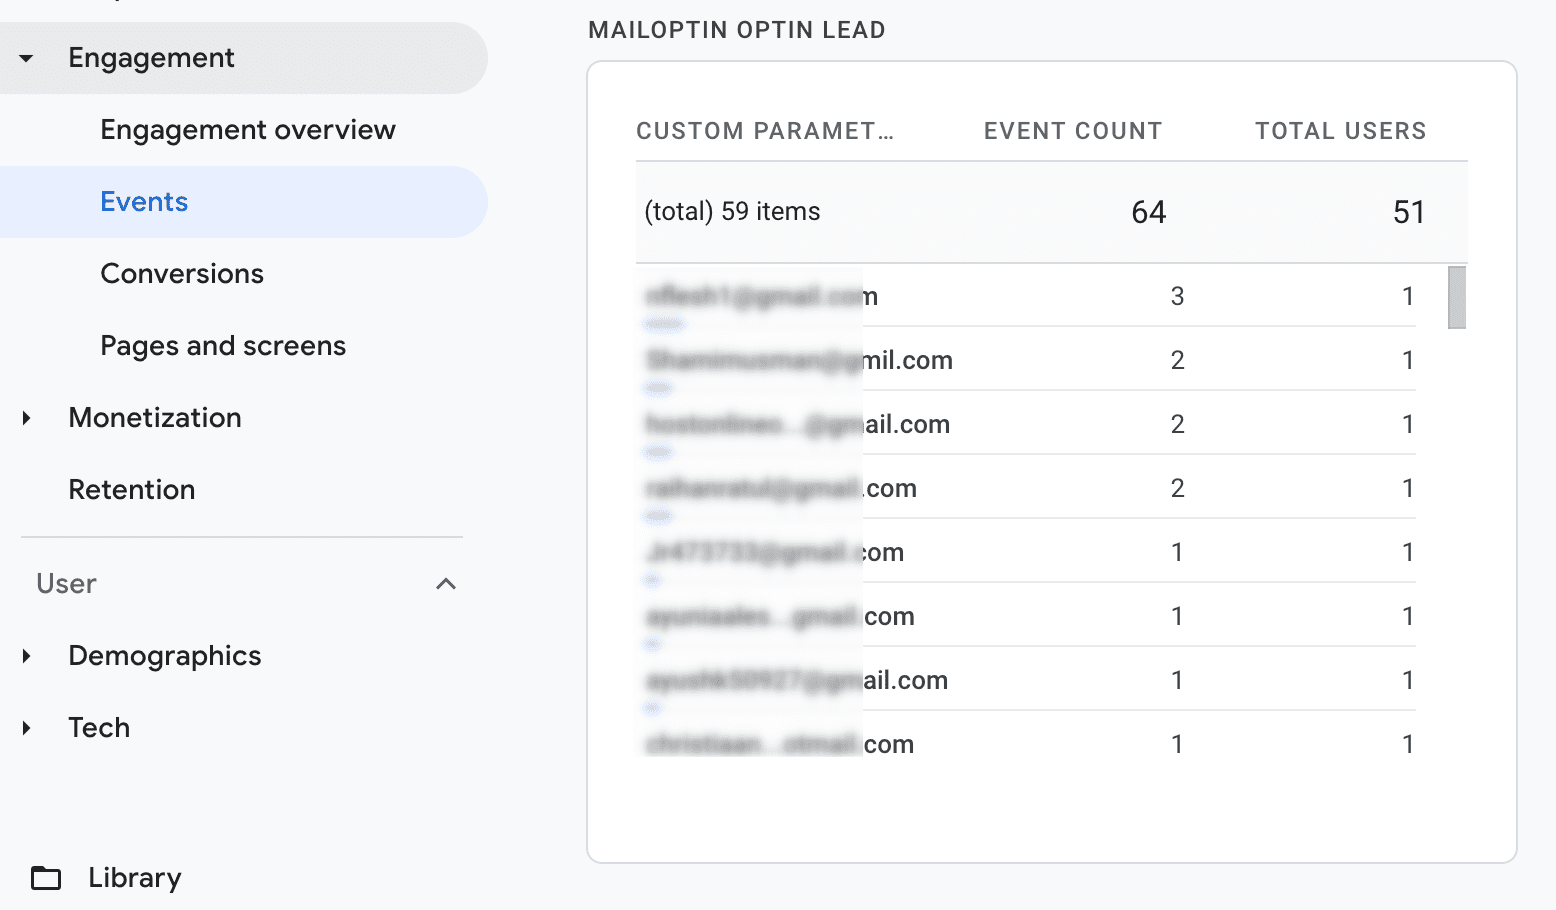
Still, on the “mailoptin_conversions” event page, see the “MAILOPTIN OPTIN LEAD” card to see a list of all leads captured.
Google Analytics 3
Navigate to Behavior » Events » Overview.
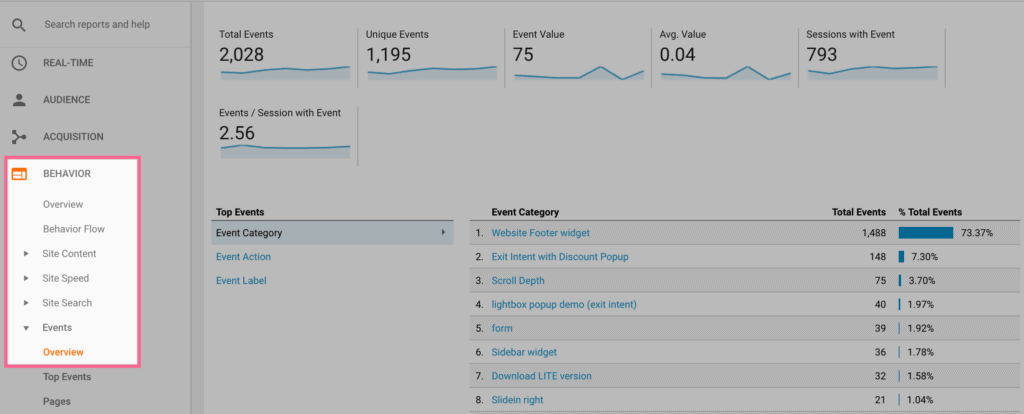
Selecting Top Events instead will show a table view of all events.
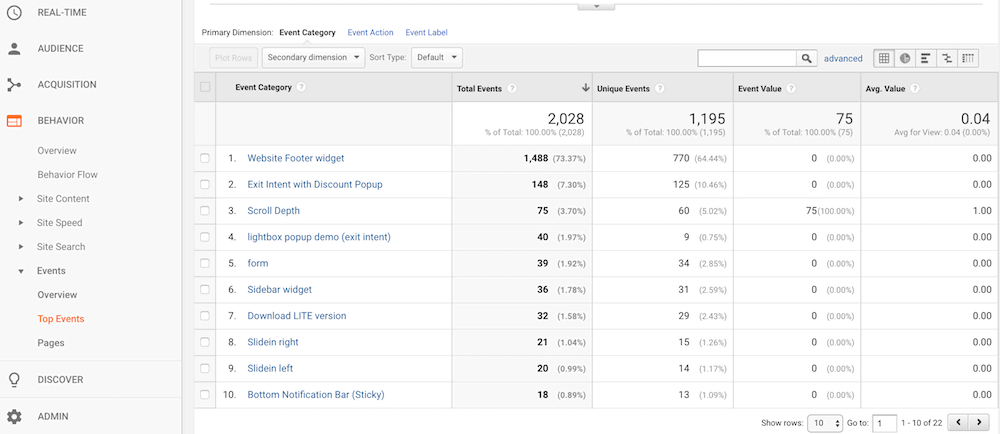
The Total Events column shows the combination of impressions and conversions accrued by each optin campaign.
To further refine the data, you can choose a specific campaign to filter the data by. For example, we’ve selected the “Download LITE version” by clicking its title.
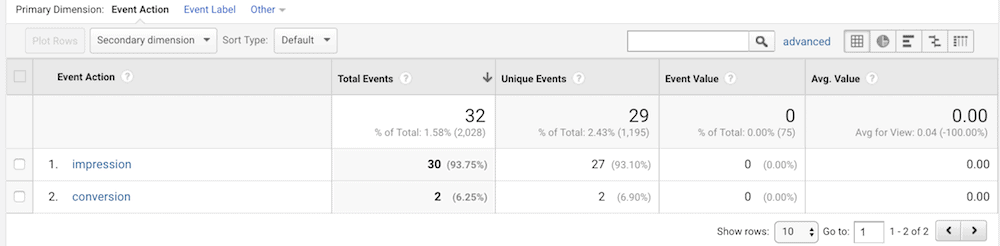
How to View All Campaigns’ Conversion Data
To see all your campaigns’ complete information at a glance, start by navigating to Behavior » Events » Top Events in Google Analytics.
Click on the Secondary dimension button to reveal a list of additional data points that can be added to the table.
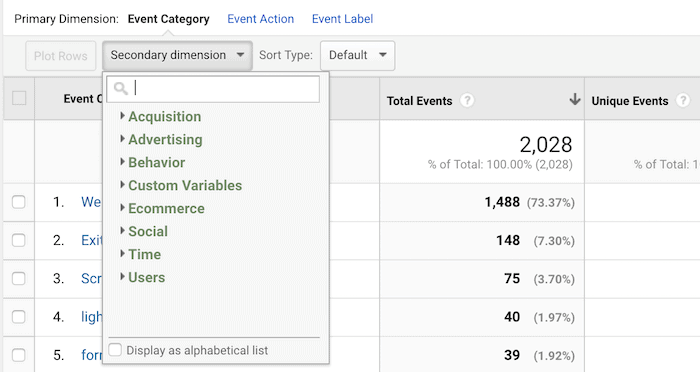
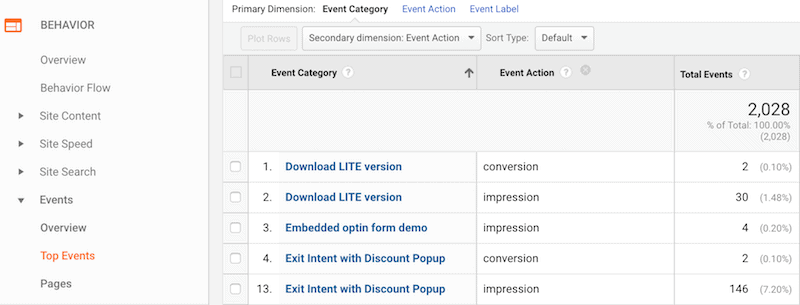
From this list, choose Behavior which will reveal a sub-menu of options. Choose Event Action. This will cause the page to refer, sh and now the numbers for Conversions and Impressions will be added to the table for each of your campaigns.
How to View Data by Traffic Source
To view and compare your a based on traffic source, navigate to Behavior » Events » Top Events.
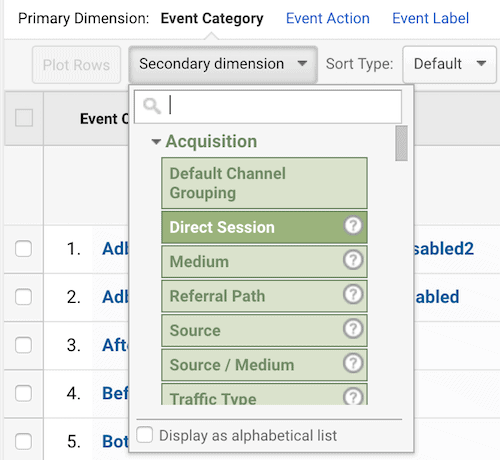
Click on the Secondary dimension button to reveal a list of additional data points that can be added to the table.
From this list, choose Acquisition then Source or Source / Medium.